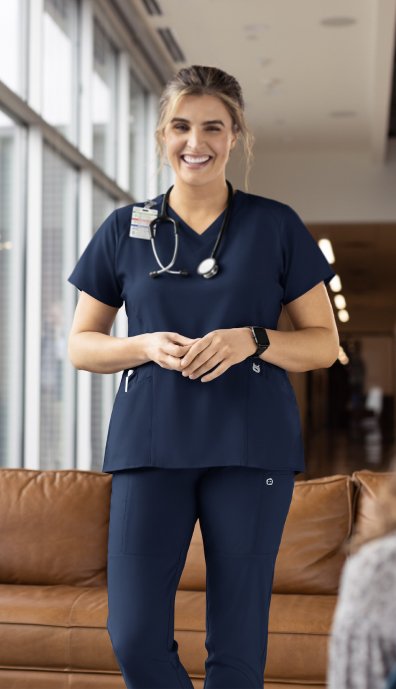
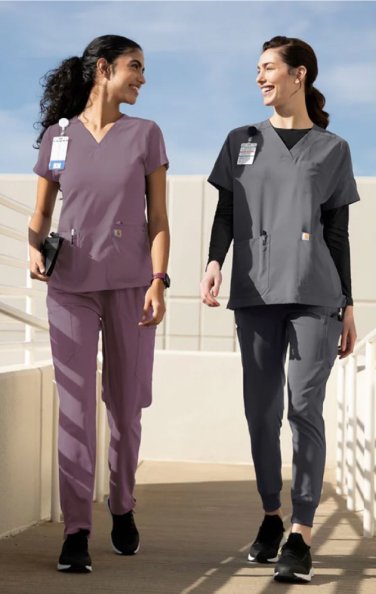
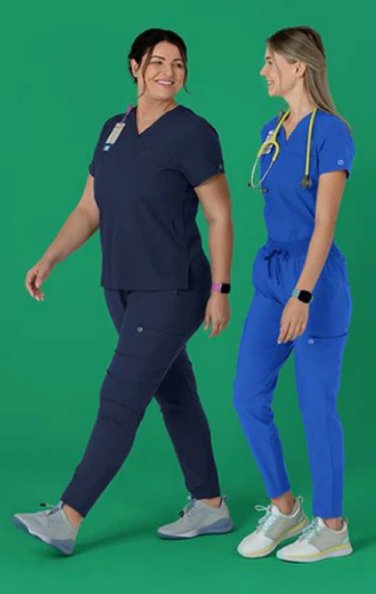
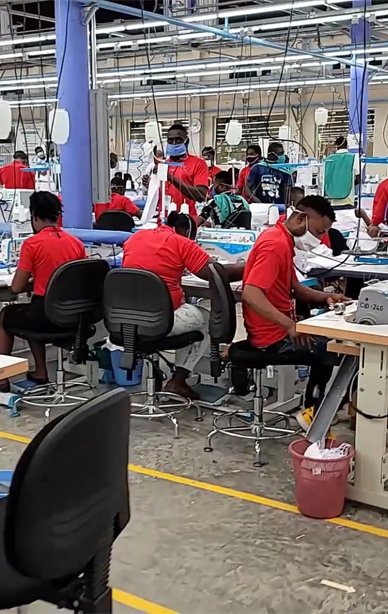
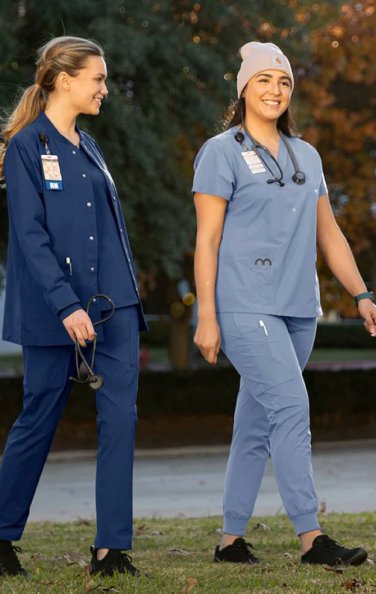
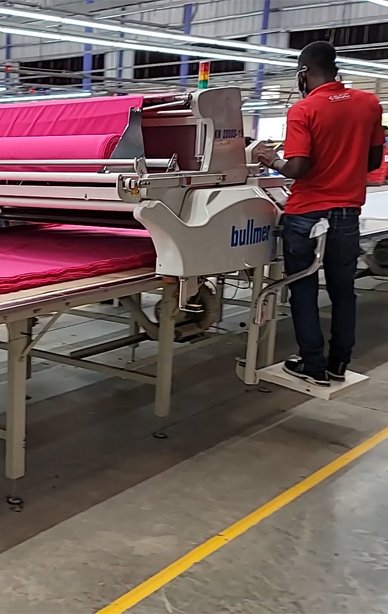
We create apparel to help the more than twenty million healthcare professionals go to work each day to do their jobs clothed in confidence and uniformed as a team.
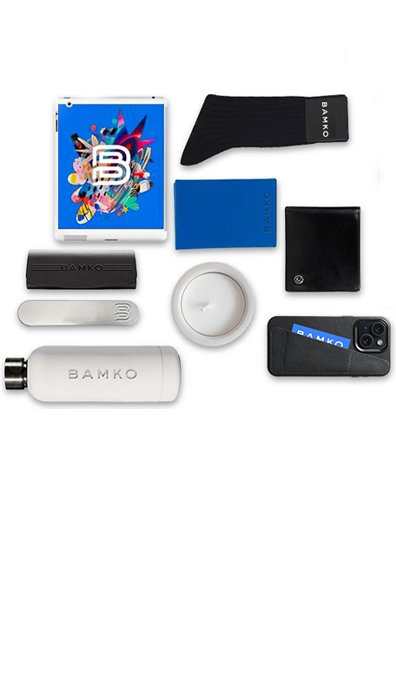
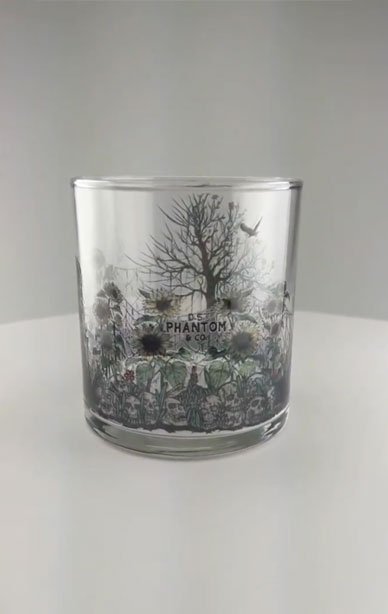
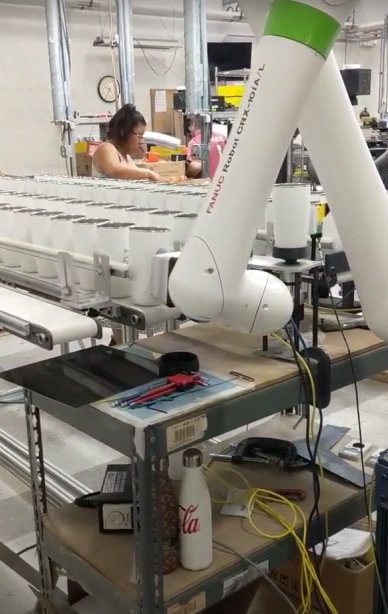
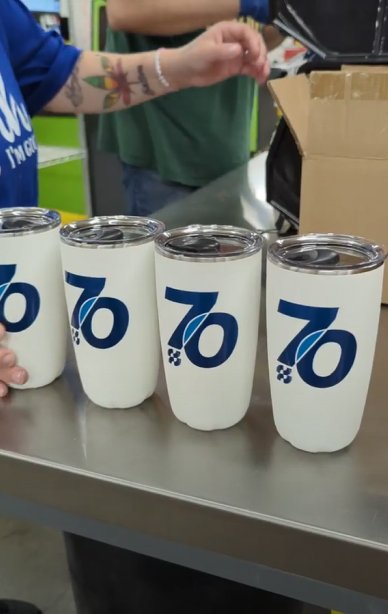
When businesses seek to amplify their brand, they turn to BAMKO, the seasoned professionals at curating custom branded merchandised based experiences that reinforce brand alignment and foster affinity for their consumers and employees alike.
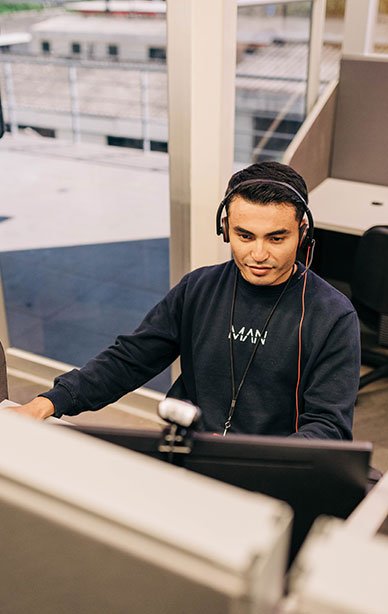
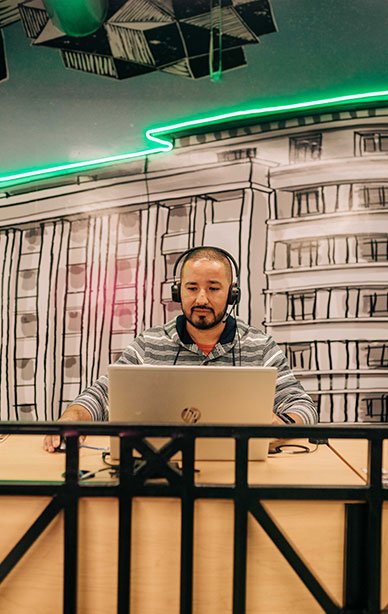
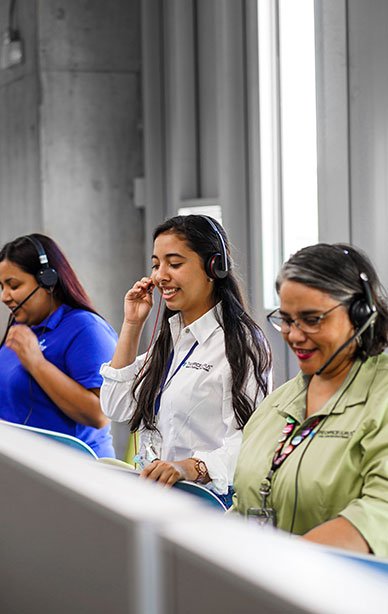
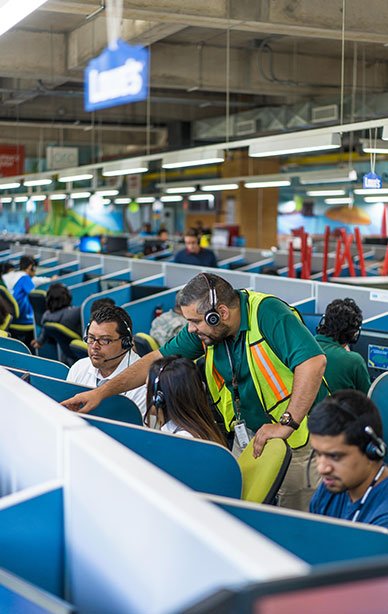
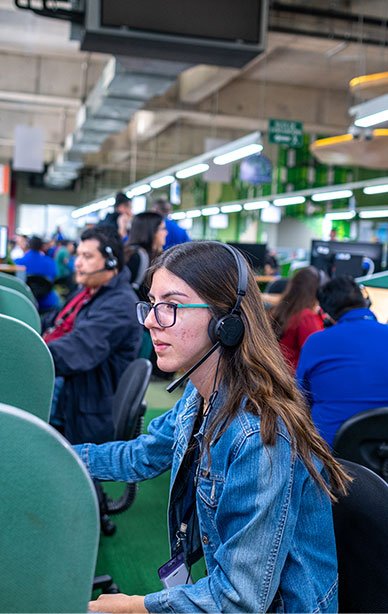
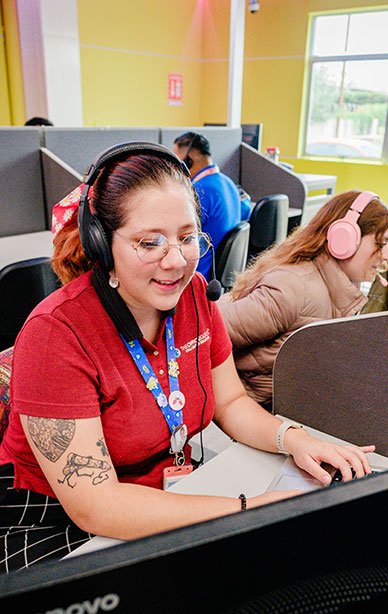
Our clients place their most prized possession in our hands daily: their customers. We are not just the voice on their consumers’ phones or the authors of their emails – we are the human connection, the embodiment of their brand values, and the champions of exceptional customer service.